Ordina / Clockwork · 2014
Pulse
2010 - 2014 - Concept, Strategy, Interaction Design, Additional Graphic Design

2010 - 2014 - Concept, Strategy, Interaction Design, Additional Graphic Design
Graphic Design: Thomas Geurink
The business challenge:
Driven primarily by mobile. social media and its attached meta data is an excellent source of information about real world events. How can this information be leveraged to give it added value.
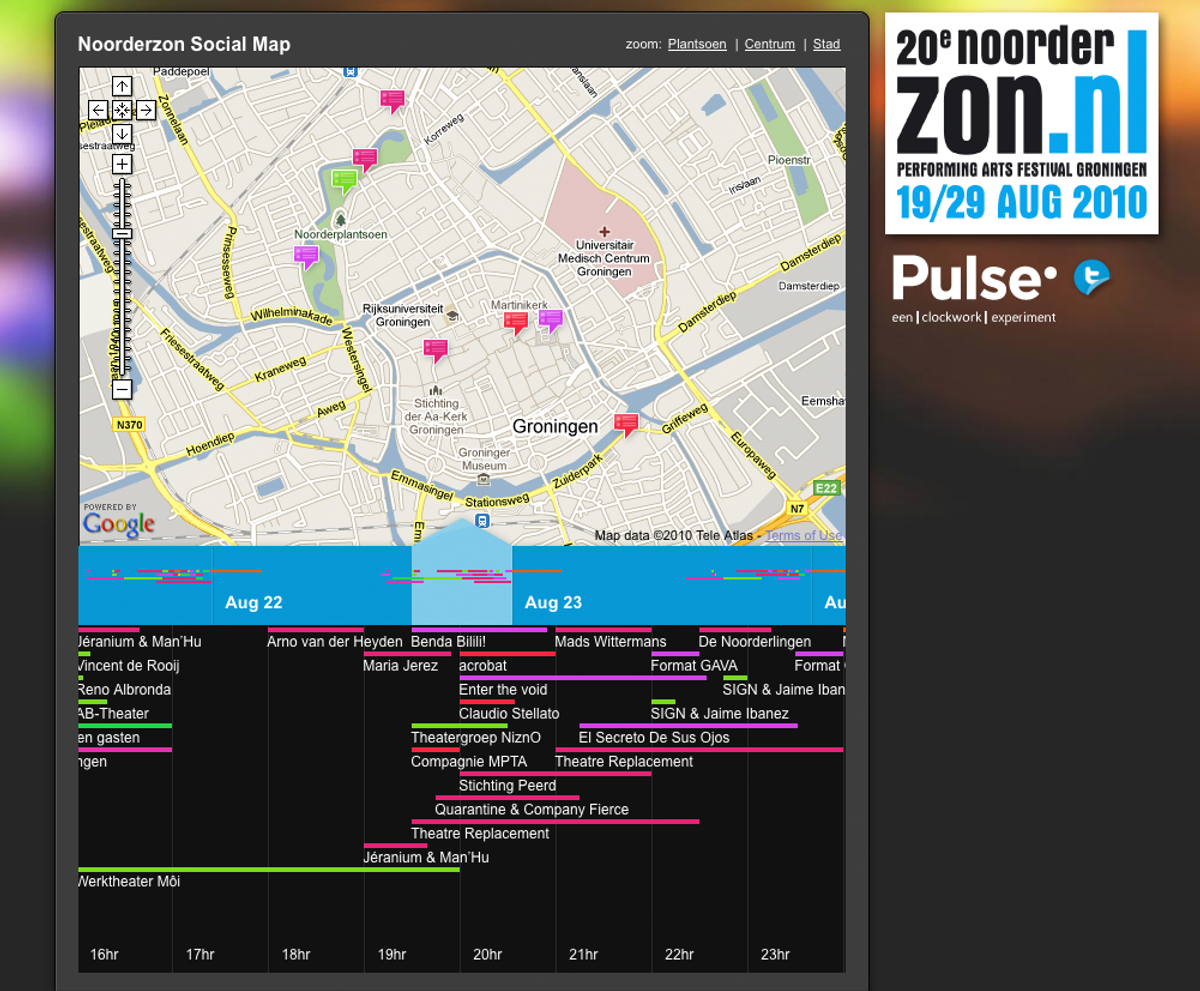
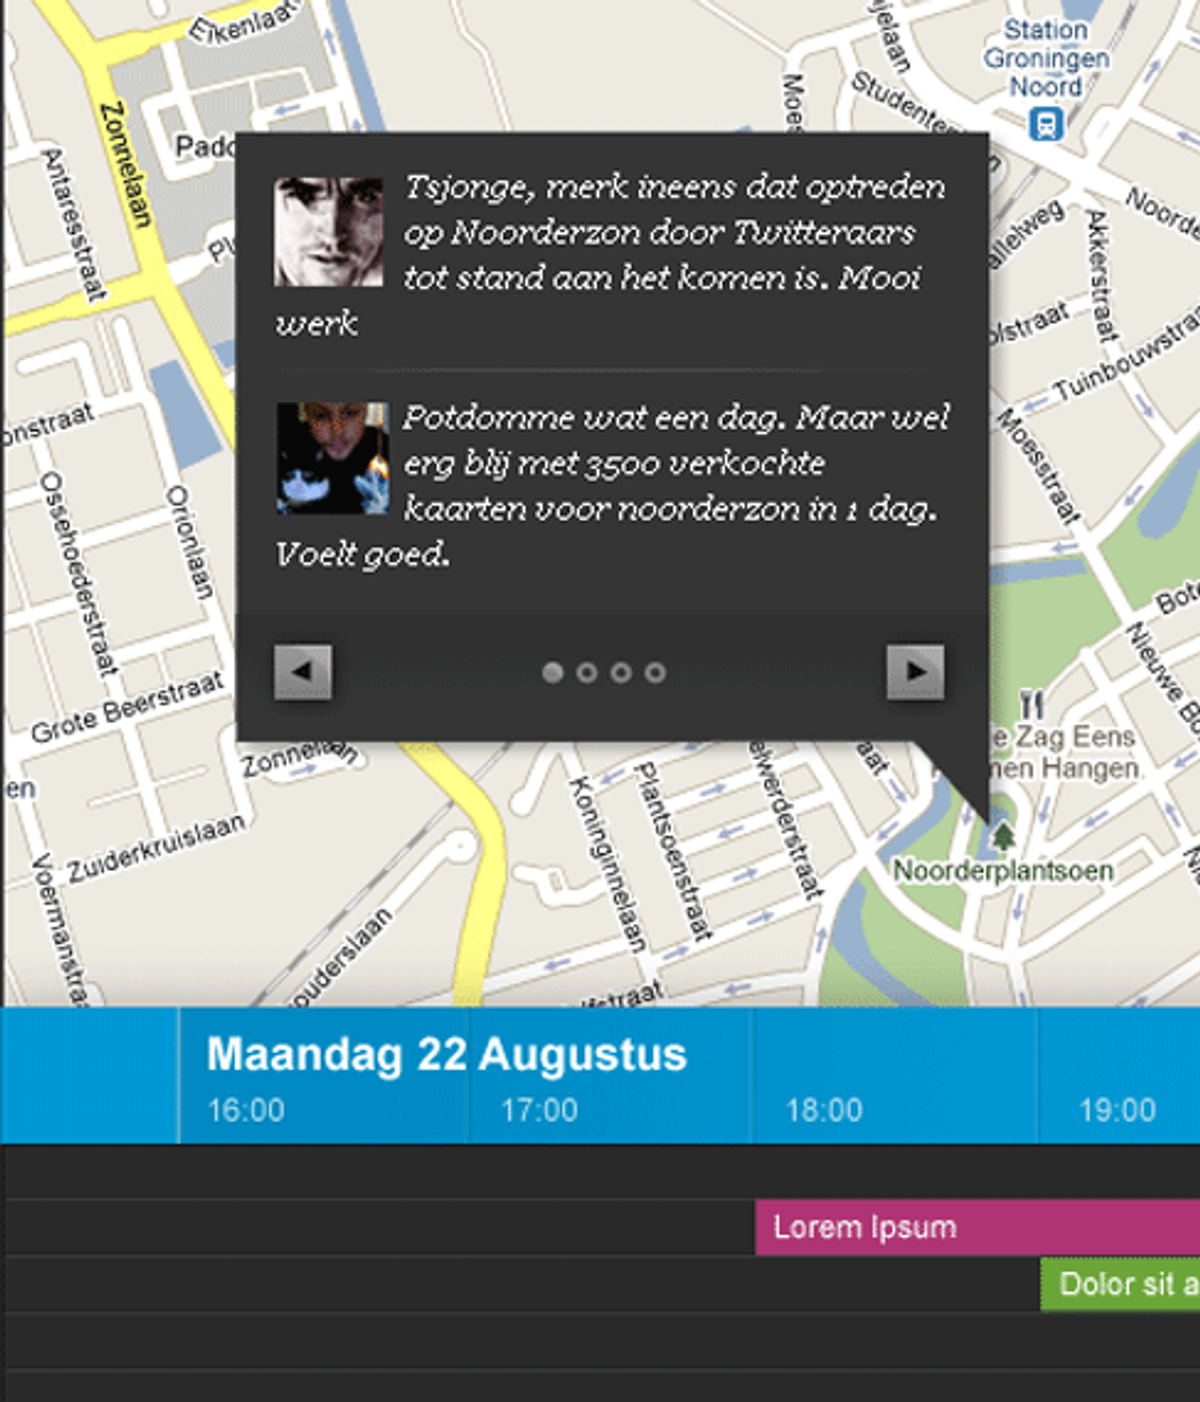
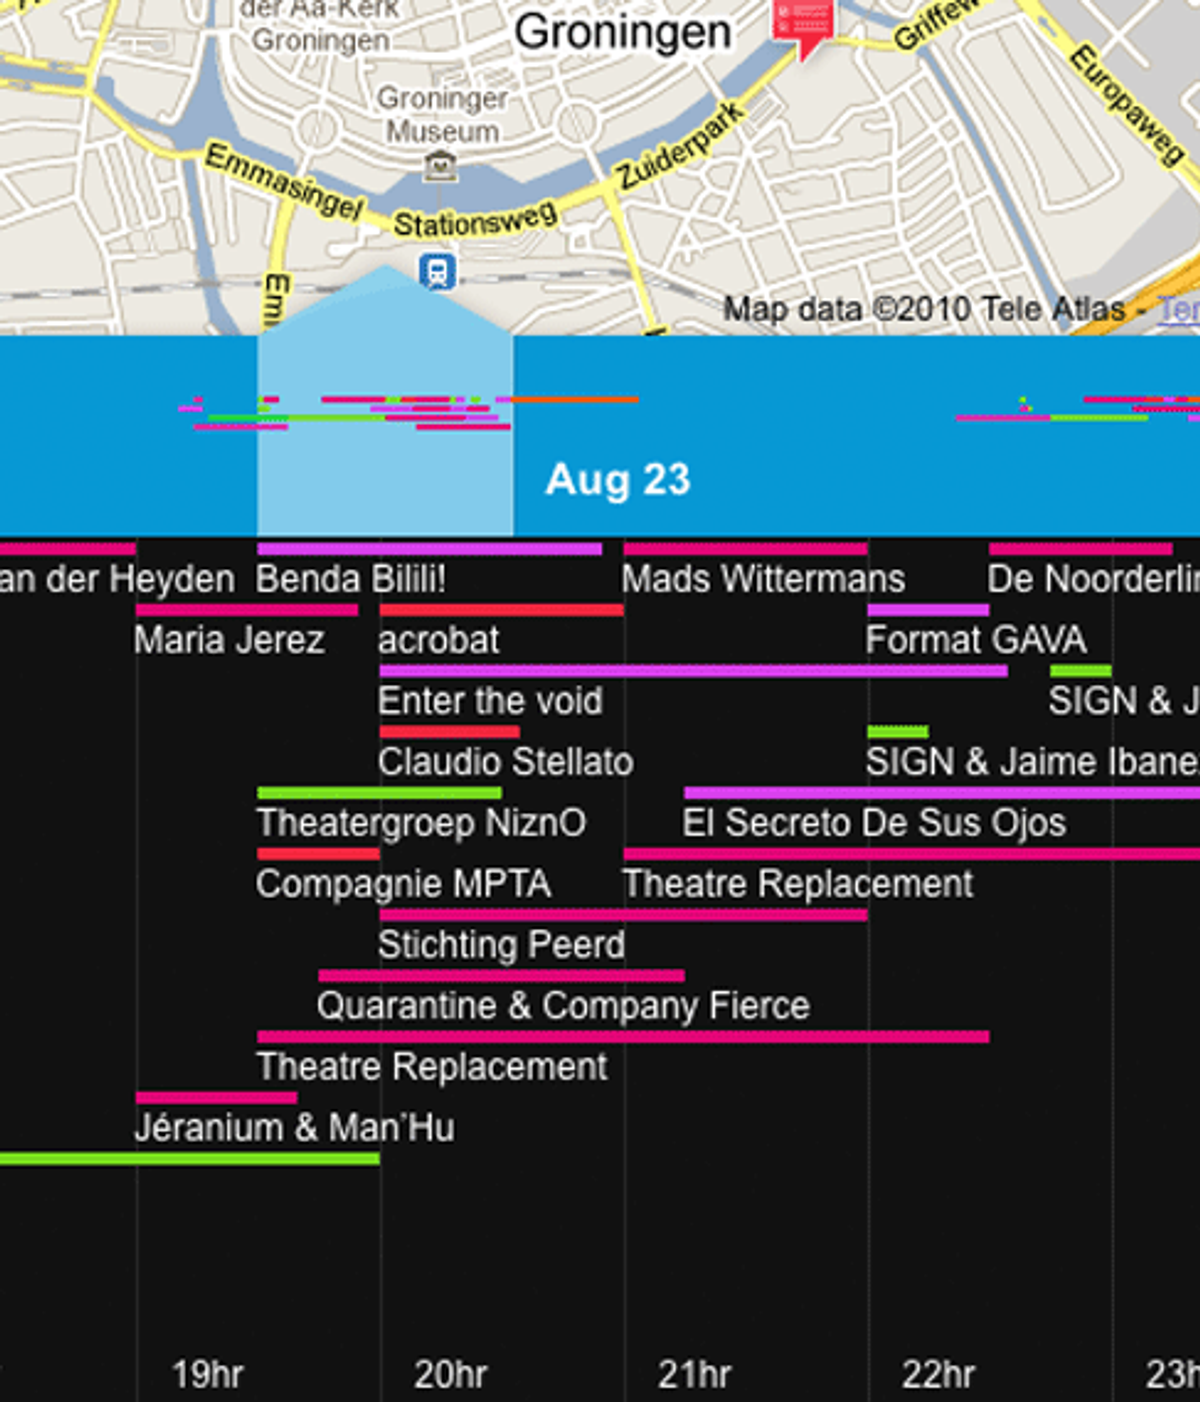
In 2010 the Twitter api was a very accessible source, the service started getting a critical audience. To experiment with ways to leverage this information in a meaningful way, we partnered with Noorderzon, an annual cultural festival. The festival takes place throughout the entire city of Groningen, which made it an excellent use case to combine geo information with intelligent data analysis.
Crowd management
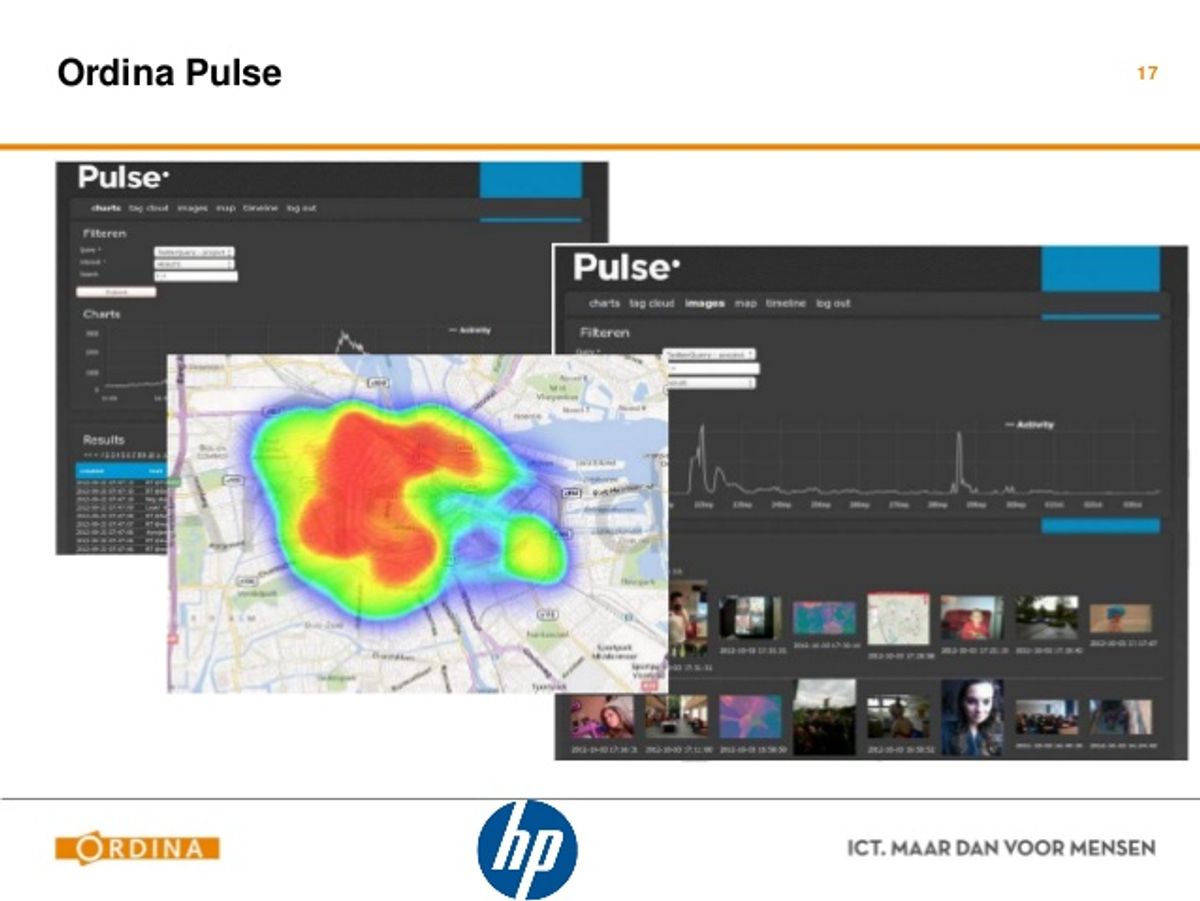
Having successfully proven the validity of our concept, Clockwork's parent company Ordina picked it up as a means to visualize big data analysis. Instead of culture, we focused on crowd control.
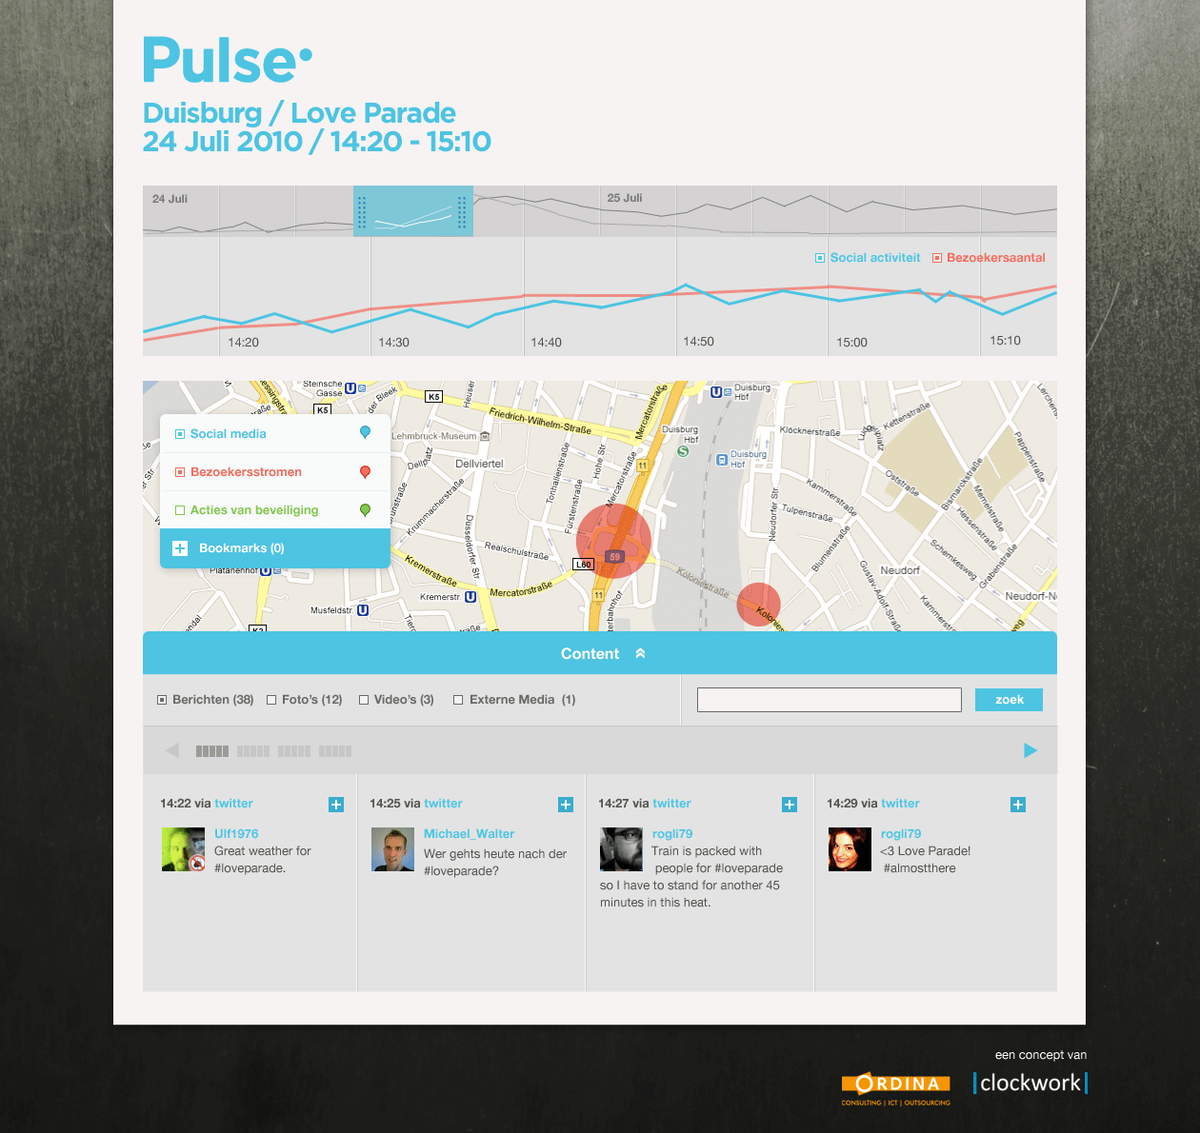
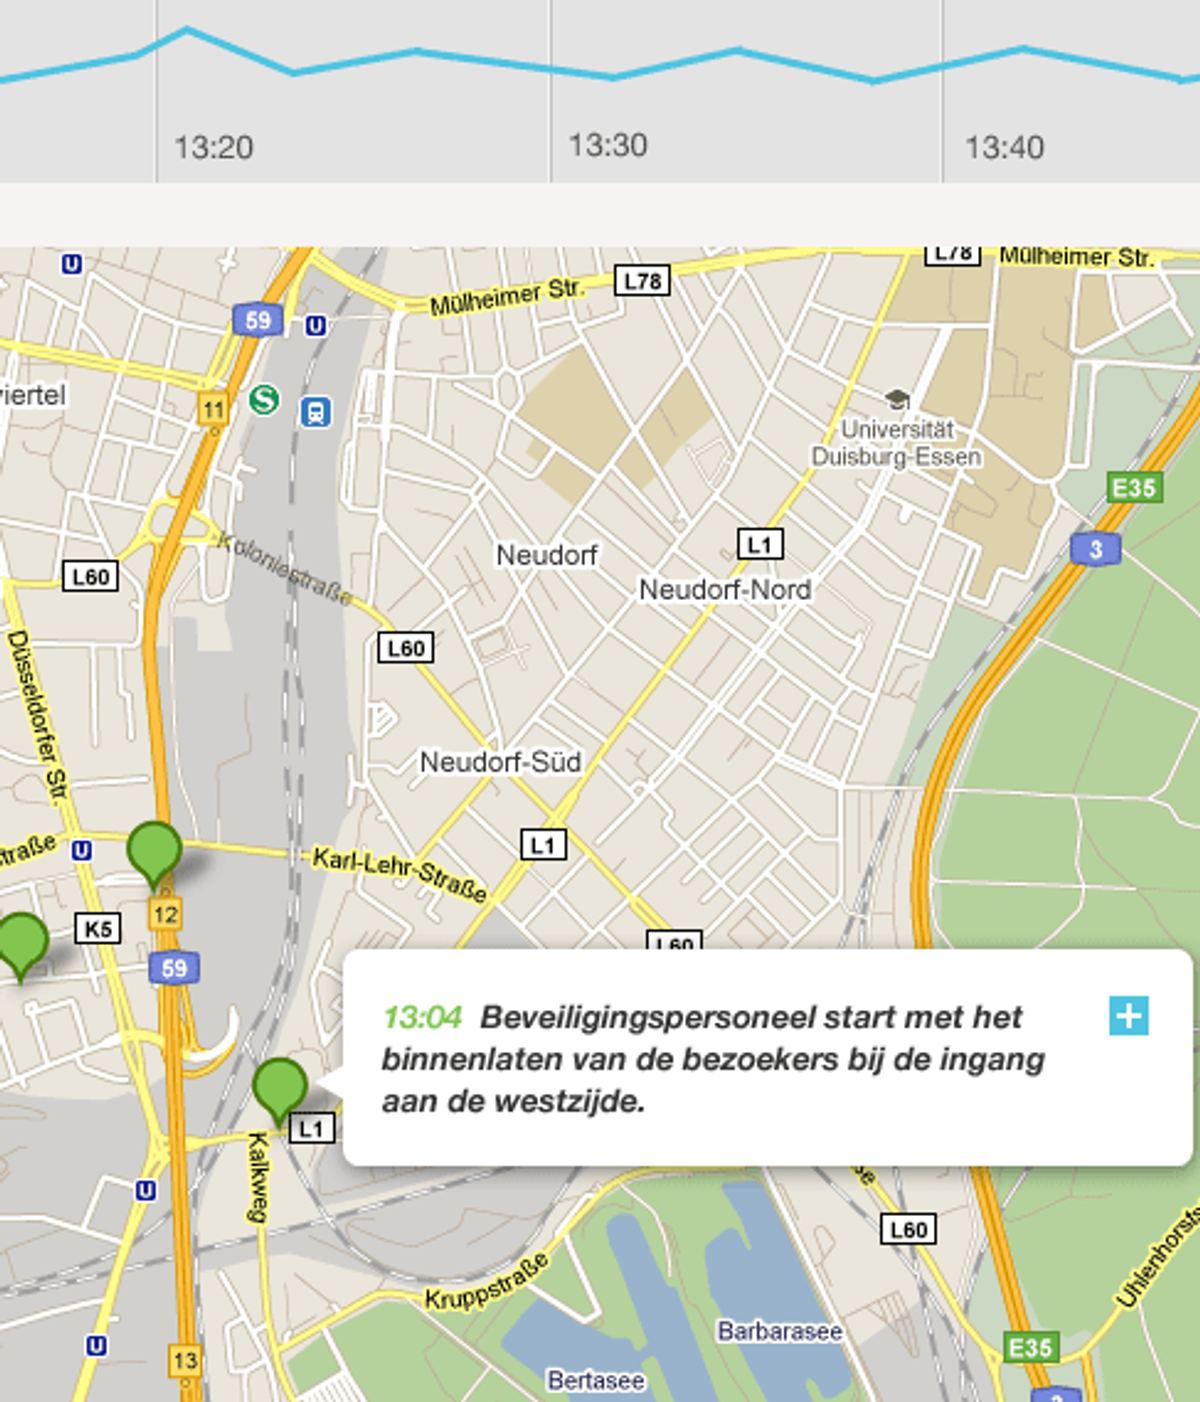
On 24 July 2010, a crowd disaster at the 2010 Love Parade in Duisburg, Germany caused the death of 21 people and injured over 500. Could this tragedy have been prevented by better insights in crowd movement, and could Pulse prove to be useful in the analysis and visualization?
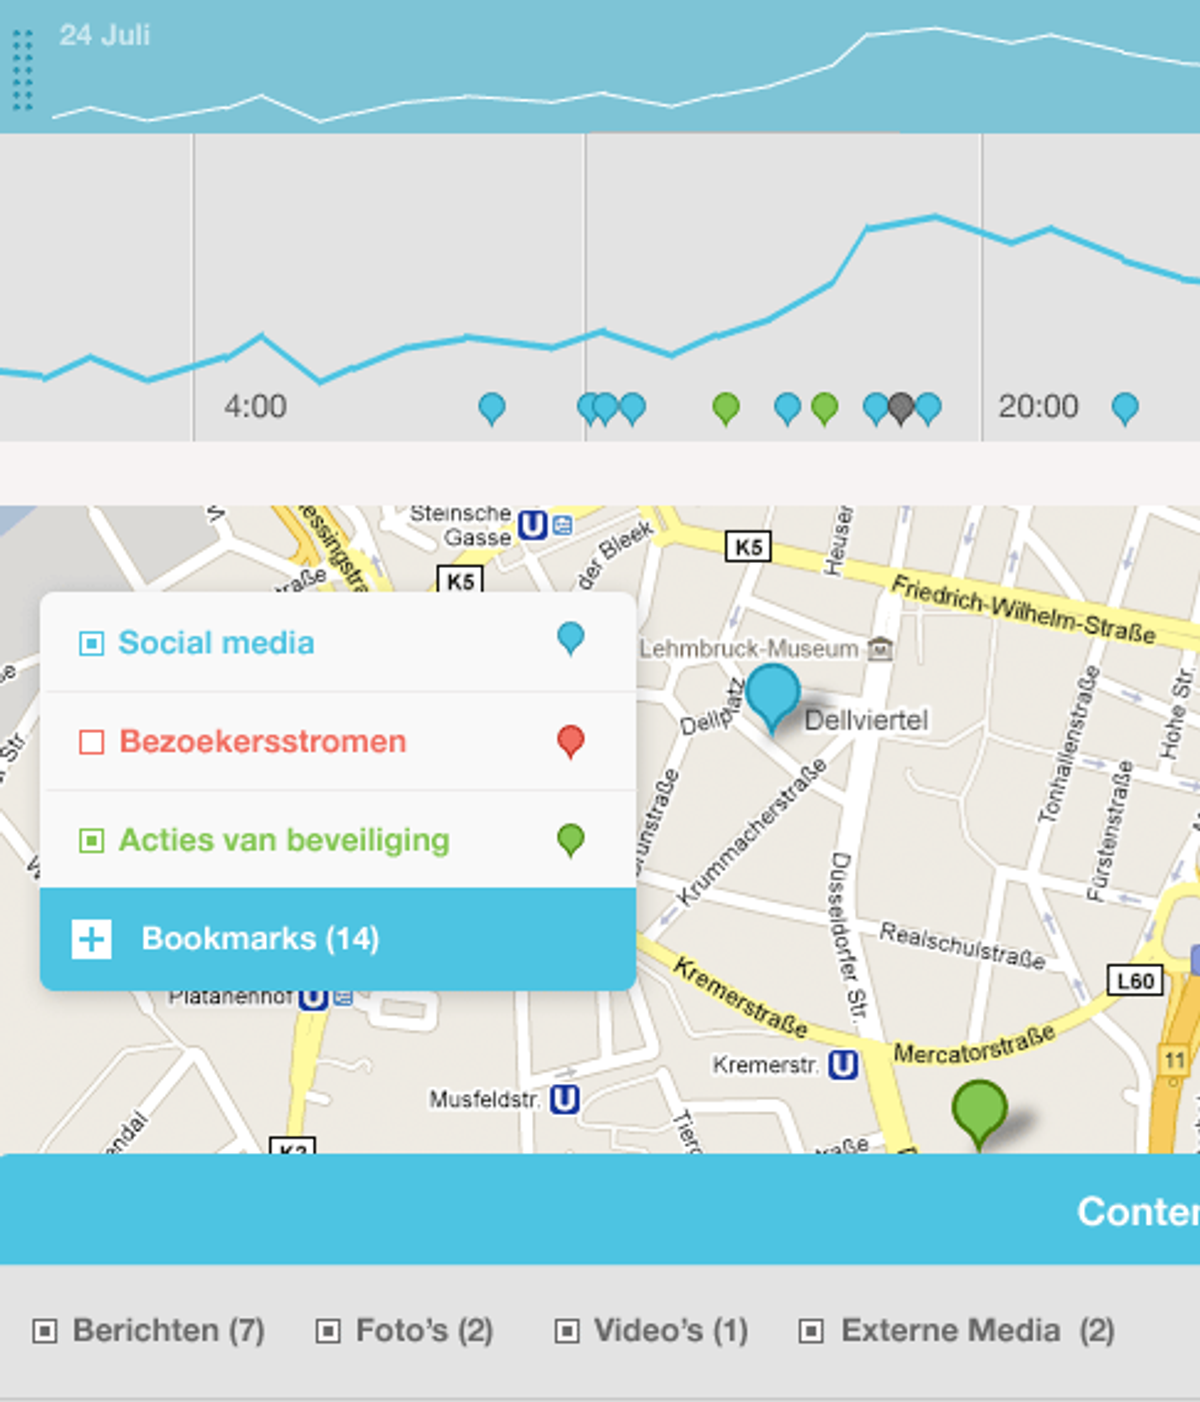
Based on the historical data, eyewitness accounts, news media publications and the Twitter API we constructed a proof of concept to reconstruct the timeline of the events.
Real world application
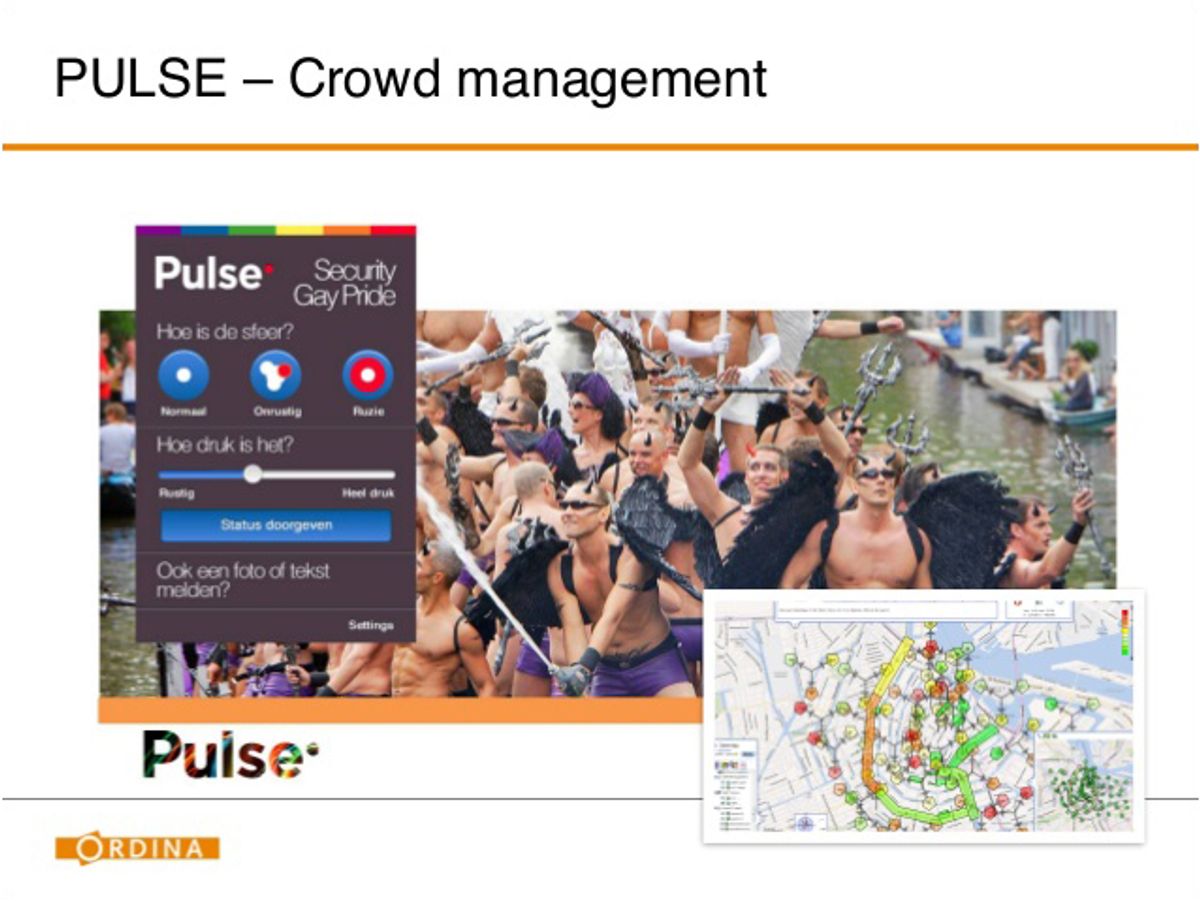
From our learnings in the Duisburg proof of concept, we adjusted the algorithms which now could handle millions of data entries. We partnered with one of the largest annual events in Amsterdam: the Gay Pride parade. Hundreds of thousands of spectators gather in the small canal streets of Amsterdam and can cause public safety hazards
To improve the accuracy of the system we added two new data sources:
- A dedicated mobile app where the audience, police and private security could report the crowd level.
- Cell tower information provided by the leading mobile operator, KPN.
These sources proved to be highly effective in analyzing and reporting crowd movements. From a mobile command post the local police was able to see, near real time, heat maps of crowd movement.